Pandemic’s decline in Kentucky: New-case average is back to last July’s level, and positive-test rate is back down to 3%

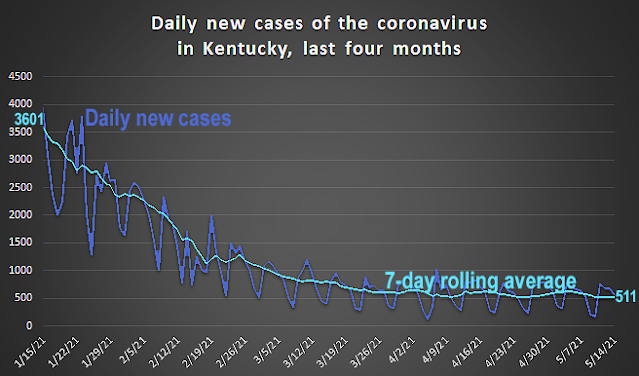
Ky. Health News graph, from state’s initial, unadjusted daily reports; to enlarge, click on it.
—–
By Al Cross
Kentucky Health News
As the pandemic in Kentucky marked a huge turning point in measures to thwart it, two daily measures of it were also landmarks.
The state reported 558 new cases of the coronavirus, lowering its seven-day rolling average to 511 cases per day. The average has not been that low since mid-July, when the state began its second surge of cases.
The statewide rate of new cases over the last seven days is 8.91 per 100,000 residents, the lowest since the state began including the metric on its daily pandemic report in December, amid the latest surge.
Counties with rates more than double the statewide rate were Webster, 36.4 per 100,000; Rockcastle, 29.1; Powell, 25.4; Montgomery, 24.4; Estill, 24.3; Adair, 23.8; Lewis, 23.7; Union, 21.9; Casey, 19.4; Mason, 19.2; Fulton, 19.1; Owen, 18.3; and Morgan, 18.2.
Counties with 10 or more new cases largely reflected population: Jefferson, 123; Fayette, 23; McCracken, 23; Warren, 18; Boone, 15; Kenton, 15; Hardin, 14; Pulaski, 13; Laurel, 11; Daviess, 10; and Grant, 10.
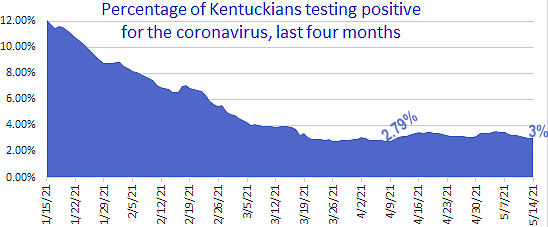
The percentage of Kentuckians testing positive for the virus in the last seven days dropped again, to exactly 3%. The rolling average has dropped for nine days in a row, from 3.57%. It was under 3% for most of late March and early April. It had been under 5%, a level of major concern, since March 1.
 |
| Kentucky Health News graph, from state Department for Public Health reports |
Kentucky hospitals reported 402 Covid-19 patients, nine fewer than Thursday, with 113 of them in intensive care (down 4) and 46 of those on a ventilator (down 1).
Two of the 10 hospital-readiness regions had more than 80% of their intensive-care beds occupied: Lake Cumberland, 91%, and the easternmost region, from Lee to Pike counties, 82%.
The state reported six more deaths from Covid-19, all from regular health-department reports, bringing the state’s official death toll from the pandemic to 6,643. In the last 14 days, there have been 9 deaths per day.
The Economist magazine estimates that the global death toll from the pandemic is about three times official figures, based on the number of deaths reported since it started and how much that total exceeds the number of deaths that would otherwise be expected. It estimates that the actual U.S. death toll from Covid-19 is 7.1% more than the 584,000 officially reported, or about 625,000; extrapolating that figure to Kentucky would make the state’s toll 7,115.
“Using known data on 121 variables, from recorded deaths to demography, we have built a pattern of correlations that lets us fill in gaps where numbers are lacking,” Economist Editor Zanny Minton Beddoes wrote. “Our model suggests that Covid-19 has already claimed 7.1 million to 12.7 million lives. Our central estimate is that 10 million people have died who would otherwise be living. . . . The most important insight from our work is that covid-19 has been harder on the poor than anyone knew. Official figures suggest that the pandemic has struck in waves, and that the United States and Europe have been hit hard. . . . Ultimately, the way to stop this is vaccination.”
