400 new cases in last two days, but fewer hospitalizations

By Al Cross
Kentucky Health News
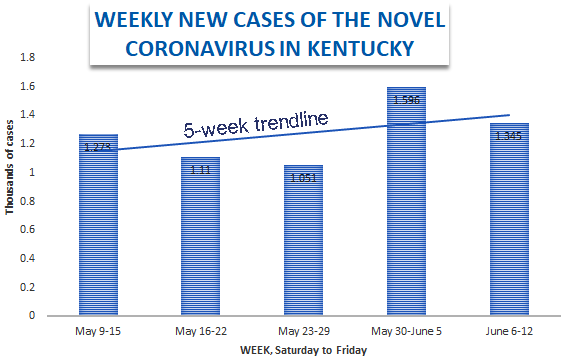
Kentucky has confirmed 400 new cases of the coronavirus in the last two days, keeping the state on a rough plateau higher than the one it had before a decline that preceded reopening of its economy.
Gov. Andy Beshear reported 331 new cases Friday, but said some of those should have been reported on Thursday, due to a problem with the federal system that compiles the data. Thursday’s number was 69.
Beshear said Thursday he will look more at hospitalizations, intensive-care cases and use of ventilators more than the number of new cases to help him decide the timing and extent of further re-openings. His press release said 418 Kentuckians are hospitalized with covid-19, with 67 of them in intensive care. Both were significantly lower than the 514 and 81 reported Thursday.
The new cases raised the state’s total to 12,166. At least 3,390 Kentuckians have recovered from the virus.
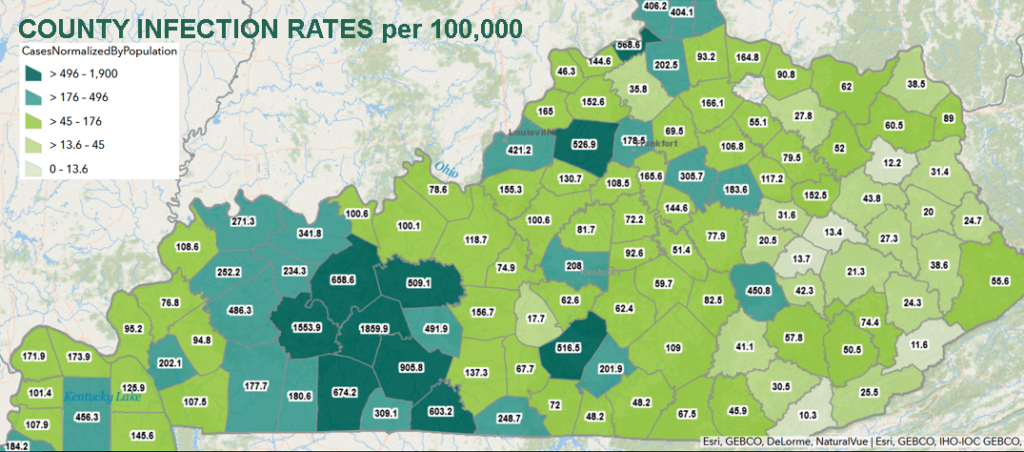
Counties with the most new cases were Jefferson, 67; Fayette, 45; Warren, 29; Shelby, 26; and Logan, 13. All those counties have had elevated rates lately; Shelby’s per-capita rate of infection now ranks in the top 10, along with Logan and Warren.
Beshear reported four more deaths from covid-19 Friday, raising the state’s death toll to 497.
“I grieve with these four new families, along with all 497 families in Kentucky who have lost a loved one to covid-19,” Beshear said. “This dangerous disease is still out there and we must stay vigilant to protect more people going forward.”
The latest fatalities were an 89-year-old woman from Fayette County and three from Jefferson County: men aged 54 and 79, and a woman, 90.
Almost exactly half the deaths from covid-19 in Kentucky, 249, have been among people 80 or older. Another 124 have been among people in their 70s, 78 among those in their 60s, and 34 among those in their 50s. The leading age groups for infections by the virus are the 30s and 40s. The state’s covid-19 dashboard has graphic displays of such data, as well as maps showing cases and case rates by population. Here’s the latest map of case rates; for a larger version, click on it.
